Employee Hierarchy Chart System
Complete guide for visualizing and managing organizational structure. Select a topic below to get started.
System Overview
Learn about the hierarchy chart features, visualization methods, and organizational structure.
Accessing the Chart
How to access and load the employee hierarchy visualization.
Navigating the Chart
Understanding chart layout, expanding/collapsing nodes, and hierarchy navigation.
Search Functionality
How to search for employees and navigate to their position in the hierarchy.
Exporting to PDF
Generate PDF reports of the organizational structure with optimized layout.
Node Design Elements
Understanding employee node components, colors, and visual indicators.
Technical Architecture
React component structure, Redux integration, and data flow.
Troubleshooting
Solutions to common issues and error handling.
System Overview
The Employee Hierarchy Chart provides interactive visualization of organizational structure with advanced search, navigation, and export capabilities.
Key Features
📊 Interactive Visualization
Expandable/collapsible tree structure with dynamic layout adjustment.
🔍 Advanced Search
Find employees and automatically expand to their position in hierarchy.
📥 PDF Export
Generate multi-page PDF reports with optimized layout.
🎨 Visual Design
Color-coded nodes, gradient avatars, and clear hierarchical connections.
👤 Employee Profiles
Employee avatars with photos, names, titles, departments, and roles.
📱 Responsive Design
Adaptive layout for desktop and mobile viewing.
Visual Elements
- Top-level managers: Blue background (#AFE0FF)
- Reporters: Pastel colors in repeating sequence
- Search matches: Yellow background with orange border
- Connector lines: Light blue (#8CCCF7)
Layout Types
- 2 columns for 1-2 top-level managers
- 3 columns for 3+ top-level managers
- Automatic positioning based on hierarchy depth
- Responsive adjustment for screen sizes
- Direct reports split into left/right columns
- Balanced distribution for readability
- Special handling for single reporters
- Consistent spacing and connectors
Accessing the Hierarchy Chart
How to access and load the employee hierarchy visualization.
- Access through main application navigation
- Navigate to "Organization Chart" or "Employee Hierarchy" section
- System requires organization ID for data isolation
- Hierarchy loads automatically on component mount
- Component receives organization ID as parameter
- Automatically fetches hierarchy data from API
- Loads employee images asynchronously
- Initializes search functionality
- Sets up PDF export capabilities
- Dispatch fetchEmployeeHierarchyRequest with organizationId
- Show loading indicator (LoadingFlower component)
- Receive hierarchical data from API
- Parse and structure data for visualization
- Load employee images on-demand
- Render initial hierarchy view
Navigating the Hierarchy Chart
Understanding chart layout, expanding/collapsing nodes, and hierarchy navigation.
Navigation Controls
- Click the blue circular button with chevron-right (▶) icon
- Located at bottom center of employee nodes with reports
- Expands to show direct reports in two-column layout
- Button changes to chevron-down (▼) when expanded

- Click the blue circular button with chevron-down (▼) icon
- Located at bottom center of expanded employee nodes
- Hides all direct reports and their descendants
- Button changes back to chevron-right (▶)
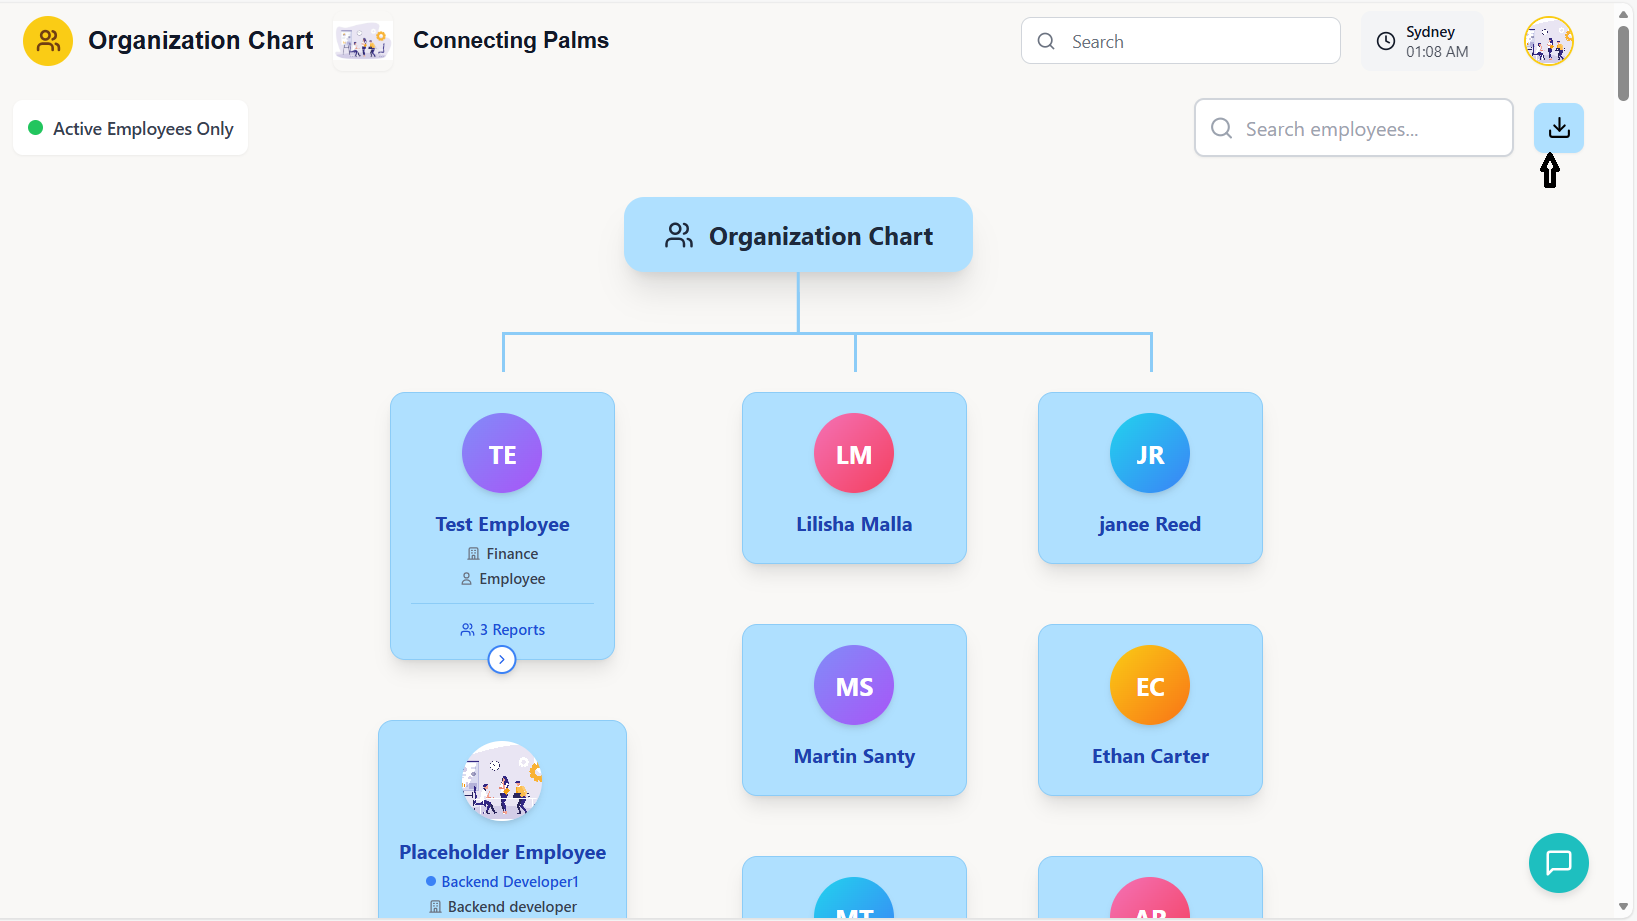
Each employee node shows:
- Profile Image/Initials: Circular avatar with gradient or photo
- Employee Name: Bold text, center-aligned
- Job Title: Below name with colored dot indicator
- Department: With building icon
- Role: With person icon
- Report Count: Number of direct reports with users icon
Layout Navigation
- Top-level managers displayed in 2 or 3 columns
- Connected to "Organization Chart" header by blue lines
- Horizontal lines connect multiple top-level managers
- Vertical lines connect to their reporter structures
- Direct reports split into left and right columns
- Connected to manager by vertical blue lines
- Horizontal line connects multiple reporters
- Recursive structure for multi-level hierarchy
- Hover effects: Nodes lift up and show shadow on hover
- Active states: Expanded nodes show deeper hierarchy
- Connection lines: Blue lines (#8CCCF7) show reporting relationships
- Scroll support: Horizontal and vertical scrolling for large hierarchies
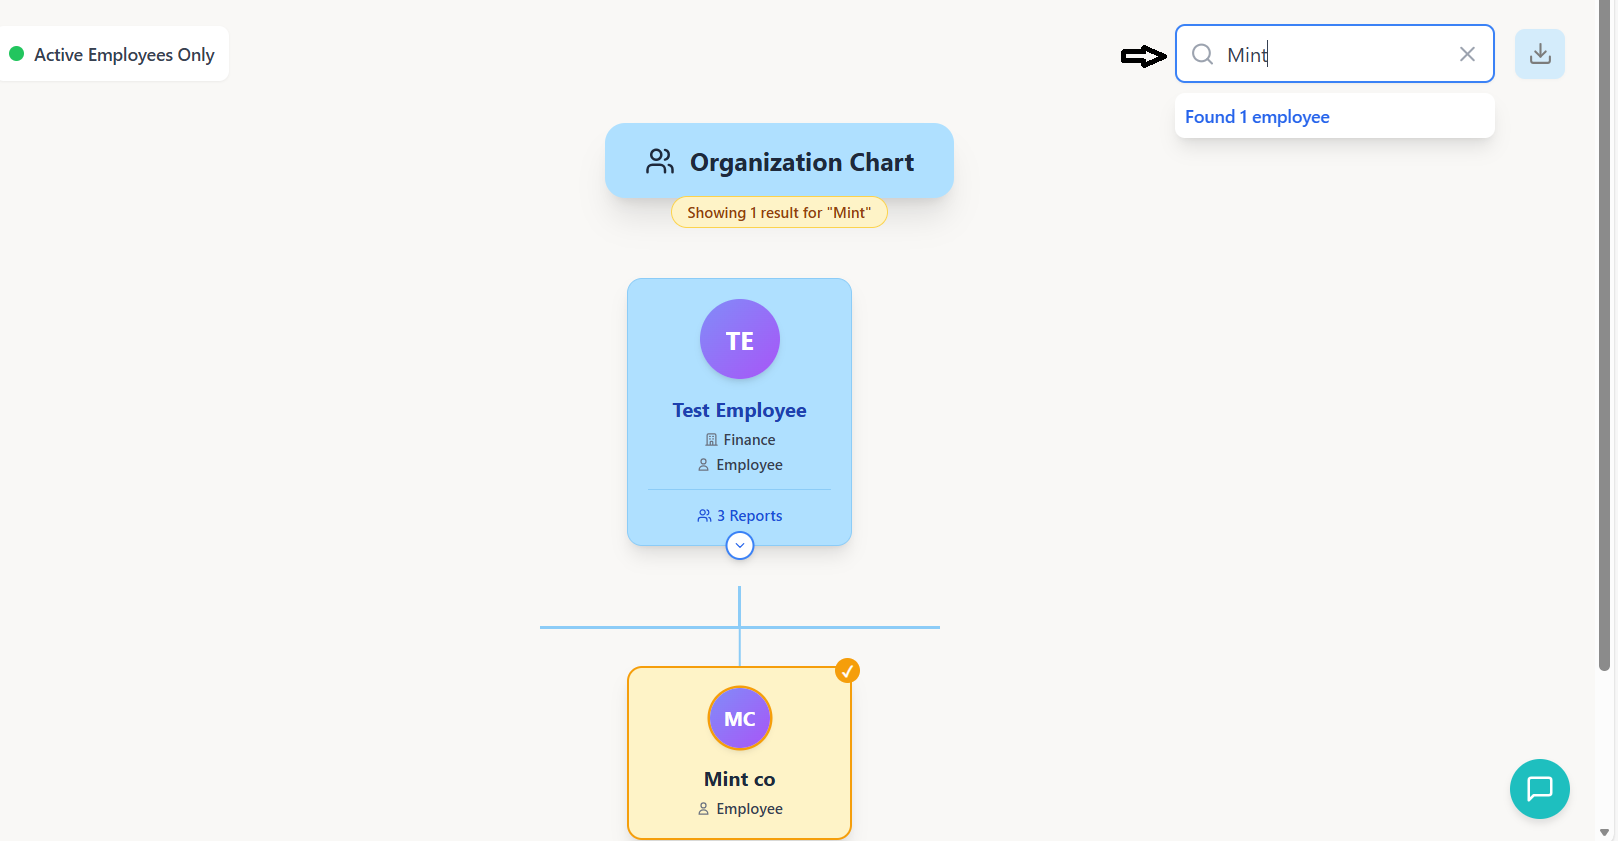
Search Functionality
How to search for employees and navigate to their position in the hierarchy.
Search Interface
- Search bar located in top-right header section
- Identified by magnifying glass icon (🔍)
- Placeholder text: "Search employees..."
- Clear button (X) appears when text is entered
- Click in search bar or use keyboard shortcut (Ctrl+F)
- Type employee name (partial or full)
- Search is case-insensitive
- Results appear in real-time as you type
- Matching employees highlighted in yellow
- Matching nodes get yellow background (#FEF3C7)
- Orange border (2px #F59E0B) around matching nodes
- Green checkmark badge in top-right corner of node
- Result count displayed below search bar
- Automatically expands hierarchy to show matching employees
Smart Hierarchy Expansion
User enters search term
Traverse hierarchy tree
Find all managers above
Show ancestors and descendants
Yellow highlight with checkmark
When an employee is found:
- All ancestor nodes (managers above) are expanded
- The found employee's node is expanded
- All descendant nodes (reports below) are shown
- Irrelevant branches remain collapsed
- View automatically focuses on the result
- Click the X button in search bar
- Or manually delete search text
- Highlights and checkmarks removed
- Hierarchy returns to previous state
- Expanded nodes from search remain expanded
Exporting to PDF
Generate PDF reports of the organizational structure with optimized layout.
Export Process
- Click the download icon (📥) button in header
- Located next to search bar
- Button has blue background (#AFE0FF)
- Hover shows "Export to PDF" tooltip
- Spinner appears during export process
- System automatically expands ALL nodes
- Creates optimized layout for PDF
- Scales down elements for better fit
- Removes interactive elements (buttons)
- Adds PDF header with title and date
- Calculates multi-page layout if needed
- Uses html2canvas for screenshot capture
- Uses jsPDF for PDF creation
- Landscape orientation (A4)
- Multi-page support for large hierarchies
- Page numbers added automatically
- Footer with copyright information
PDF Optimization Features
📄 Multi-page Support
Automatically splits large hierarchies across multiple pages with page numbers.
🎯 Element Scaling
Reduces node sizes, font sizes, and spacing for optimal PDF layout.
📋 Header/Footer
Adds professional header with title/date and footer with copyright.
🖼️ Image Optimization
Compresses images and reduces avatar sizes for smaller file size.
Export Workflow
User initiates export
Show complete hierarchy
Scale and remove interactivity
html2canvas conversion
jsPDF creation
PDF saved locally
Organization-Chart-YYYY-MM-DD.pdf (current date)
Node Design Elements
Understanding employee node components, colors, and visual indicators.
Employee Avatar System
Priority order for avatar display:
- Gradient Initials: If no photo or loading fails
- Gradient Color: Generated from employee name
- Initials: First letters of first and last name
| Level | Size Class | Dimensions | Font Size |
|---|---|---|---|
| Top-level | Large | 64px × 64px | 1.25rem (xl) |
| Middle-level | Medium | 48px × 48px | 1rem (base) |
| Low-level | Small | 32px × 32px | 0.75rem (xs) |
Node Information Sections
- Name: Bold, centered, color varies by level
- Title: With colored dot indicator
- Top-level: Blue dot, blue text
- Others: Gray dot, gray text
- Department: With building icon (🏢)
- Role: With person icon (👤)
- Both use gray text and small icons
- Centered alignment
- Report Count: Number of direct reports
- Icon: Users icon (👥)
- Style: Border-top separator, smaller text
- Color: Blue for top-level, gray for others
- Only shown for employees with reports
Color Coding System
| Role | Background Color | Border Color | Purpose |
|---|---|---|---|
| Top-level Manager | #AFE0FF (Light Blue) | #8CCCF7 | Distinguish leadership |
| Search Match | #FEF3C7 (Light Yellow) | #F59E0B (Orange) | Highlight search results |
| Direct Report | Pastel Colors* | #8CCCF7 | Visual grouping |
*12 pastel colors in repeating sequence
12-color pastel sequence (30% opacity):
Colors repeat in sequence based on reporter position
Interactive Elements
- Position: Absolute, bottom-center of node
- Style: White circle with blue border
- Icons: Chevron-right (▶) / Chevron-down (▼)
- Hover: Light blue background
- Z-index: 30 (above other elements)
- Position: Absolute, top-right corner
- Style: Amber circle with checkmark
- Size: 20px × 20px
- Content: White checkmark (✓)
- Only appears for search matches
Technical Architecture
React component structure, Redux integration, and data flow for the hierarchy chart.
Component Structure
- Props: organizationId (required)
- State: expandedNodes, searchTerm, searchResults, columnPositions
- Refs: columnRefs, containerRef, requestedImagesRef
- Effects: Data fetching, search processing, position updates
- Render: Header, search, export button, chart container
- Props: employee, size, className
- Features: Photo loading, gradient fallback, initials
- Size Options: small, medium, large
- Fallback: Gradient based on name hash
Key Functions
| Function | Purpose | Parameters |
|---|---|---|
| renderNodeLabel | Create employee node UI | node, isTopLevel, hasChildren, isSearchMatch, isExpanded, parentNode |
| renderChildrenTwoColumns | Render reports in 2-column layout | node |
| renderDynamicColumnLayout | Top-level managers in 2/3 columns | None |
| renderDynamicConnectors | Draw connection lines | None |
| Function | Purpose | Returns |
|---|---|---|
| getReporterColor | Determine node background color | Color string |
| getBorderColor | Determine node border color | Color string |
| splitIntoTwoColumns | Split children array into two | [leftColumn, rightColumn] |
| splitIntoThreeColumns | Split items into three columns | [col1, col2, col3] |
| shouldShowNode | Filter nodes during search | Boolean |
Data Flow Architecture
Organization ID provided
Redux async thunk
Transform API response
Top-level nodes only
Expand, search, export
Re-render with changes
Performance Optimizations
🖼️ Lazy Image Loading
Employee images loaded on-demand with caching to prevent duplicate requests.
🎯 Conditional Rendering
Nodes filtered during search to improve rendering performance.
📏 Dynamic Layout
Column positions calculated once and reused for connector drawing.
🔄 Memoization
Color calculations and column splits cached to prevent recomputation.
Troubleshooting Guide
Solutions to common issues and problems you may encounter.
Common Issues
Possible Causes:
- Invalid or missing organization ID
- Network connectivity issues
- API server down or unreachable
- Authentication/authorization problems
- Browser CORS policy restrictions
Solutions:
- Verify organization ID is correct and provided
- Check internet connection and network status
- Check browser console for API errors (F12)
- Refresh the page (F5)
- Clear browser cache and cookies
- Contact system administrator
Possible Causes:
- No hierarchy data loaded
- Employee name doesn't match search term
- Search processing JavaScript error
- Case sensitivity confusion
Solutions:
- Wait for hierarchy data to load completely
- Try partial names or different spellings
- Check browser console for JavaScript errors
- Search is case-insensitive - no need for exact case
- Clear search and try again
Possible Causes:
- Large hierarchy causing timeout
- Browser memory limitations
- html2canvas/jsPDF compatibility issues
- Ad blocker or security software interference
- Insufficient disk space for download
Solutions:
- Wait longer for large organizations (can take 30+ seconds)
- Close other tabs to free browser memory
- Try different browser (Chrome recommended)
- Disable ad blockers temporarily
- Check available disk space
- Export smaller sections by collapsing nodes first
Possible Causes:
- Employee has no profile image uploaded
- Image server down or unreachable
- CORS policy blocking image loading
- Slow network causing timeout
- Browser cache issues
Solutions:
- Check if other employees' images load
- Verify image API endpoint is accessible
- Clear browser cache and hard refresh (Ctrl+F5)
- Wait for images to load (lazy loading)
- Gradient initials are normal fallback behavior
Possible Causes:
- Very large organization (1000+ employees)
- Too many expanded nodes
- Browser memory leaks
- Slow device or browser
- Network latency for image loading
Solutions:
- Collapse unnecessary nodes
- Use search to find specific employees
- Close other browser tabs
- Use more powerful device/browser
- Wait for initial load to complete
- Contact admin about performance optimization
Error Message Reference
| Error Message | Possible Cause | Solution |
|---|---|---|
| "No hierarchy data found" | Empty organization or API returns no data | Verify organization has employees, contact admin |
| "Error loading data" | API call failed | Check network, refresh page, contact support |
| "Export failed" | PDF generation error | Try again, use different browser, reduce hierarchy size |
| Loading spinner stuck | Infinite loading state | Refresh page, check console for errors |
| Blank white screen | JavaScript error during render | Refresh, clear cache, check browser console |
Browser Compatibility
- Chrome: Version 80+ (Recommended)
- Firefox: Version 75+
- Safari: Version 13.1+
- Edge: Version 80+ (Chromium-based)
Unsupported:
- Internet Explorer (all versions)
- Older mobile browsers
Developer Tools
- Browser Console: Check for JavaScript errors (F12)
- Network Tab: Monitor API requests and responses
- Redux DevTools: Inspect application state (if installed)
- Performance Tab: Identify rendering bottlenecks
- Application Tab: Check local storage and cache
Contact Support
- Persistent errors after trying all solutions
- Data appears incorrect or missing
- Performance issues on capable hardware
- Feature requests or enhancements
- Security concerns
Information to Provide:
- Browser name and version
- Operating system and version
- Steps to reproduce the issue
- Error messages (screenshot if possible)
- Organization ID (if appropriate)
- Network conditions and location
Quick Reference Guide
🔄 Refresh
Shortcut: F5 or Ctrl+R
When: Data not loading, UI stuck
🔍 Search
Shortcut: Ctrl+F
When: Finding specific employee
📥 Export
Location: Top-right download icon
When: Need PDF report
▶ Expand All
Note: No direct button
Workaround: Export PDF then cancel